Cryptocurrency markets never sleep. Their constant movement, driven by global events, investor psychology, and rapid innovation, creates both opportunities and risks for everyday investors. For students, young professionals, entrepreneurs, and anyone keen on practical financial education, understanding crypto technical analysis is a vital skill. It bridges the gap between raw price data and actionable investment decisions, helping you avoid costly mistakes and seize opportunities with greater confidence.
What is Crypto Technical Analysis?
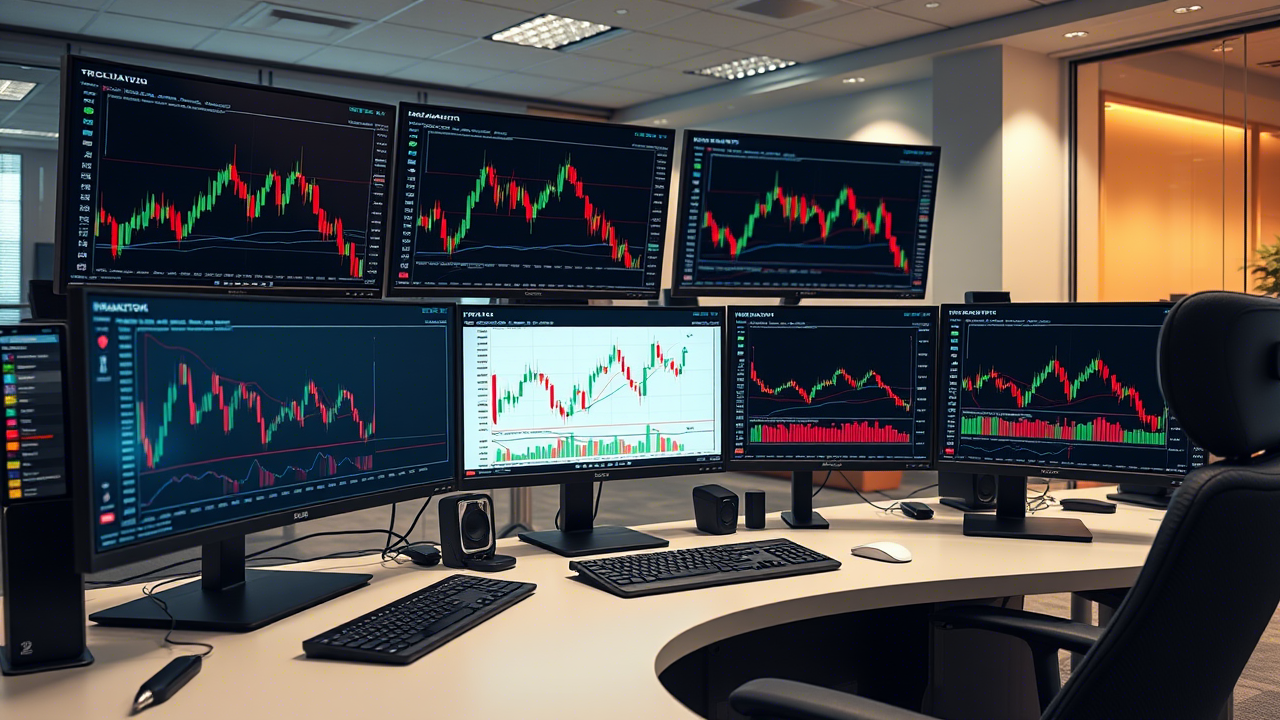
Technical analysis in crypto is the art and science of studying price charts and trading volumes to forecast future trends. Unlike fundamental analysis, which explores the underlying value of a project, technical analysis focuses on patterns, indicators, and market psychology visible in historical data. This approach is especially powerful in crypto, where prices can swing wildly in a matter of hours.
Imagine watching the price of Bitcoin late at night. A sudden surge or drop can trigger panic or euphoria. With technical analysis, you learn to read these movements, spot repeating patterns, and make informed choices—rather than reacting emotionally.
If you’re new to digital assets, start with our Crypto Investment for Beginners guide and Cryptocurrency for Beginners: Digital Currency Guide.
Why Technical Analysis Matters in Crypto
Crypto’s volatility is legendary. Unlike traditional markets, cryptocurrencies trade 24/7, and their prices often react instantly to news, social media trends, and regulatory changes. In this environment, technical analysis becomes a practical toolkit:
- Timing your trades: Spotting trends early helps you buy low and sell high.
- Managing risk: Setting stop-losses and take-profits based on chart signals protects your capital.
- Avoiding emotional pitfalls: Data-driven strategies reduce the urge to chase hype or panic sell.
Consider the 2021 bull run, when Bitcoin’s price soared on optimism. Those who understood technical analysis could ride the wave, while others who bought late or sold in fear often lost out. Learning to decode charts empowers you to act with clarity, not emotion.
Getting Started: Crypto Technical Analysis for Beginners
Starting with technical analysis doesn’t require a financial background. Begin by mastering the basics:
- Support and resistance: These are price levels where buying or selling pressure repeatedly halts or reverses a trend.
- Trendlines: Drawing lines along rising or falling prices helps visualize the market’s direction.
- Candlestick charts: Each candlestick shows price movement over a set period, revealing patterns of buying and selling.
Platforms like TradingView and CoinMarketCap offer free, interactive charts for practice. Join communities like crypto technical analysis reddit to learn from other traders, share ideas, and get feedback.
For more on analyzing prices, explore Crypto Prices: How to Analyse Market and Prices.
Essential Chart Patterns and Their Meaning
Recognizing chart patterns is like learning a new language. Patterns such as head and shoulders, double tops and bottoms, triangles, and flags often signal when a trend is about to reverse or continue. For example, a “double bottom” pattern after a long decline may indicate that buyers are returning, hinting at a possible upward move.
To keep these patterns handy, download a crypto technical analysis chart patterns pdf. Visual references make it easier to spot these signals in real time.
Deepening Your Knowledge: Books and PDF Resources
While online articles and videos are valuable, books and PDFs offer structured, in-depth learning. The Crypto Technical Analysis Alan John PDF is a favorite among beginners for its focus on trading psychology and pattern recognition. Classic books by Steve Nison and John Murphy cover candlestick patterns and technical indicators in detail.
For a curated reading list, see Investing in Cryptocurrency: Complete Beginner Guide.
Apps and Tools: Making Technical Analysis Accessible
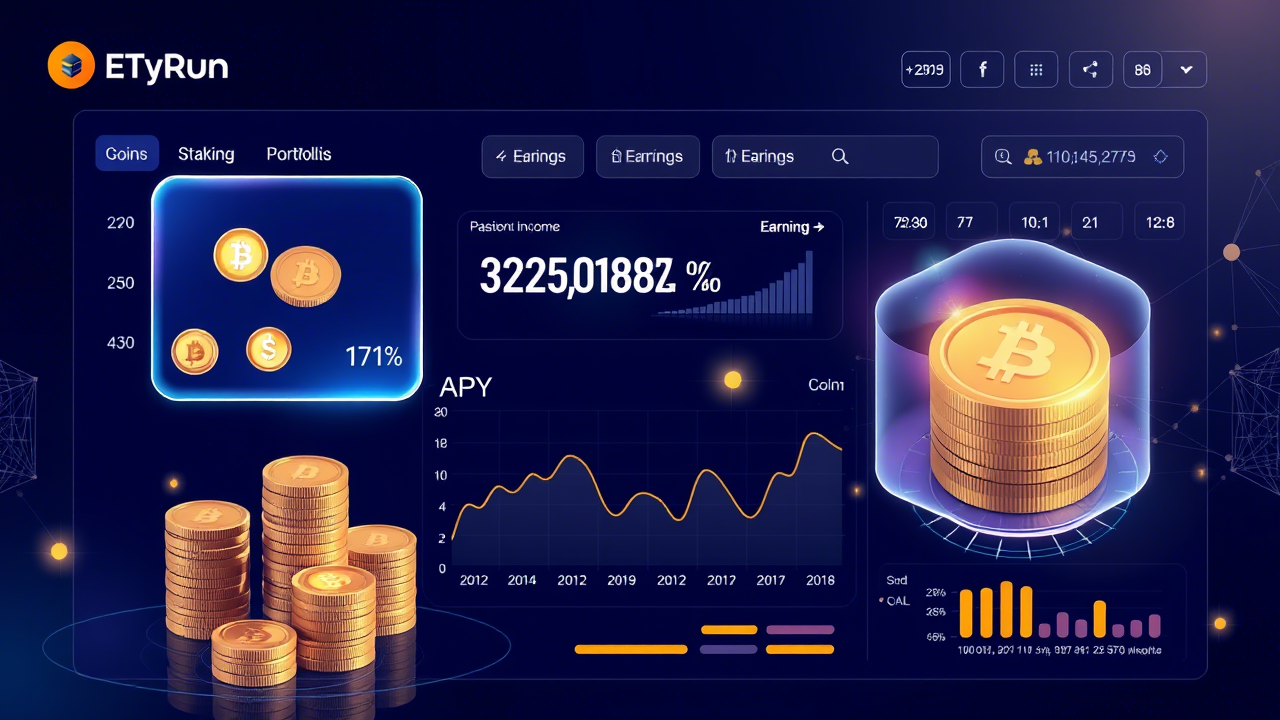
Modern technology brings technical analysis to your fingertips. Free apps like TradingView, CryptoCompare, and CoinGecko allow you to chart prices, set alerts, and apply technical indicators from your phone or computer. These tools are designed for both beginners and advanced users, offering everything from basic line charts to complex overlays.
Websites like CoinMarketCap and CoinGecko provide live price data, historical charts, and community sentiment analysis. For Indian investors, Best Crypto Exchanges in India: Compare Guide 2025 offers insights into platforms with robust charting features.
Screeners: Filtering Opportunities in a Sea of Coins
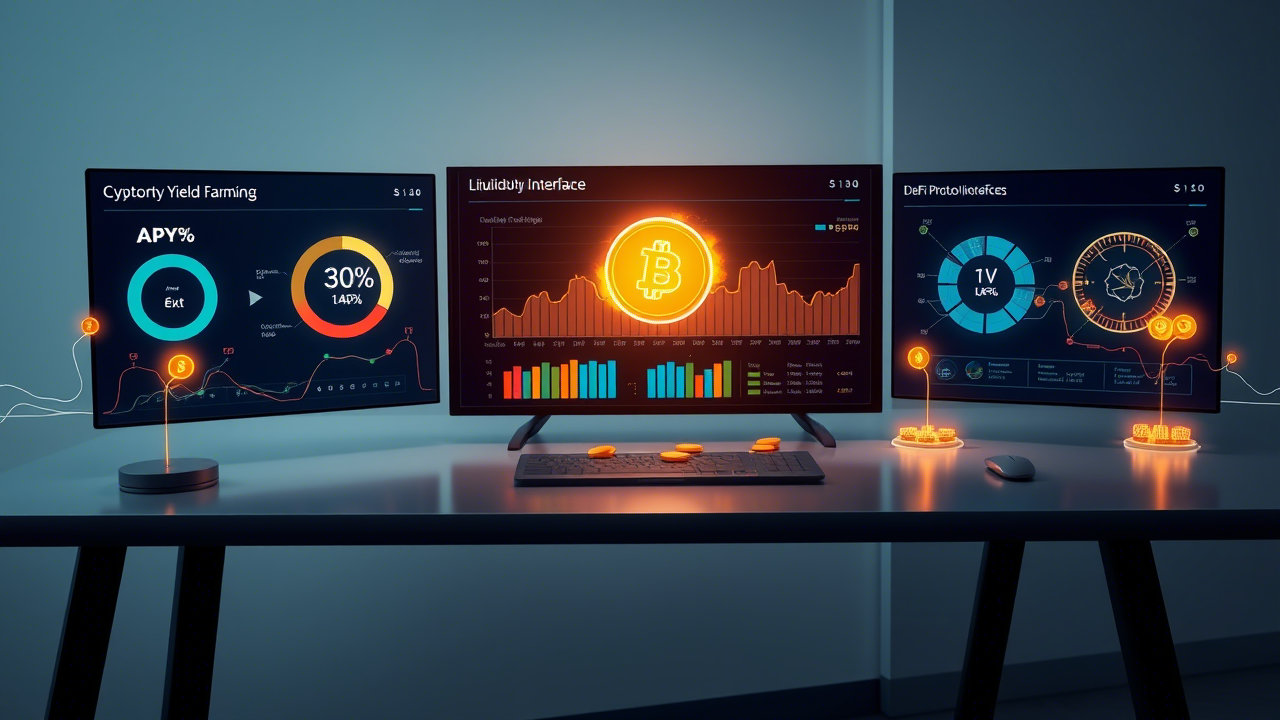
With thousands of cryptocurrencies on the market, screeners help you focus on coins that match your strategy. A crypto technical analysis screener lets you filter assets based on moving averages, RSI (Relative Strength Index), MACD (Moving Average Convergence Divergence), and volume trends.
For example, you might use a screener to find coins that are “oversold” (low RSI) or breaking out above their 50-day moving average. This approach saves time and brings discipline to your trading.
Free and Paid Courses: Learning by Doing
Education is your best investment. Many platforms offer free courses on technical analysis, covering everything from basic chart reading to advanced trading strategies. Interactive modules, quizzes, and live practice sessions help reinforce your skills.
For actionable strategies, explore Crypto Trading Strategies That Actually Work in 2025.
Real-World Example: Applying Technical Analysis
Let’s meet Aarav, a young professional in Pune. He’s curious about Ethereum’s recent price swings. By analyzing the chart on TradingView, he spots a “bullish flag” pattern—a sign that the price may soon break higher. He confirms this with rising trading volume and sets a buy order just above the flag’s resistance. Aarav also places a stop-loss to manage risk. When the breakout happens, he captures a healthy profit, all thanks to disciplined technical analysis.
Integrating Technical Analysis with Portfolio Management
Technical analysis isn’t just for day traders. Long-term investors use it to time entries and exits, diversify across strong coins, and set stop-losses to protect capital. For a complete guide to portfolio building and security, see Crypto Wallet: Everything You Need to Know Before Investing in Crypto.
Combining Technical and Fundamental Analysis
While technical analysis helps you decide when to buy or sell, fundamental analysis answers what to buy. For example, you might use technical signals to time your entry into a fundamentally strong project. Combining both approaches increases your odds of success.
Deepen your understanding of blockchain fundamentals with What Is Blockchain Technology: Simple Explanation and Blockchain Technology: Distributed Ledgers Systems.
Community Wisdom: Learning from Others
Reddit and other online forums are treasure troves of crowd-sourced knowledge. In the crypto technical analysis reddit community, traders share chart analyses, trade ideas, and market updates. By participating, you gain new perspectives, spot emerging trends, and avoid common pitfalls.
For more on market psychology, visit CryptoPanic: How to Understand Investor Emotions.
Staying Updated: News, Trends, and Alerts
Crypto markets evolve quickly. Stay ahead by following news on CoinDesk, CoinTelegraph, and Paisagyaan’s market analysis. Influencers on YouTube and Twitter often share live chart breakdowns and trade setups. Set price and trend alerts on your favorite apps to react quickly to market moves.
Downloadable Resources: PDFs for On-the-Go Learning
Offline resources like PDFs are perfect for deep study and quick reference. Whether it’s a chart patterns guide or the Alan John PDF, having these documents on hand helps reinforce your learning. For more, see How to Buy Bitcoin: Complete Guide for Investors.
Building a Personal Technical Analysis Toolkit
Every investor’s toolkit is unique, but a few essentials stand out:
- TradingView for charting and strategy testing
- CoinMarketCap and CoinGecko for data and research
- Screeners to filter coins by technical signals
- Secure wallets for asset protection
For wallet security, visit Crypto Wallet: Everything You Need to Know Before Investing in Crypto.
Pitfalls to Avoid in Technical Analysis
Even with the best tools, mistakes happen. Common pitfalls include:
- Overtrading: Chasing every signal can rack up fees and losses.
- Ignoring risk management: Always set stop-losses and never risk more than you can afford to lose.
- Chasing hype: Don’t buy based on rumors or FOMO.
- Neglecting fundamentals: Technicals matter, but so do the project’s fundamentals.
For a guide to avoiding common mistakes, see Cryptocurrency Mistakes: Common Pitfalls and How to Avoid Them.
FAQ
What is crypto technical analysis?
Crypto technical analysis is the practice of studying price charts and trading volumes to predict future price movements. It helps investors make data-driven decisions by identifying trends, entry and exit points, and potential risks.
Where can I find a crypto technical analysis PDF?
You can find free and paid crypto technical analysis PDFs on educational sites, trading forums, and guides like Alan John’s. Paisagyaan and similar platforms offer downloadable PDFs for offline learning and quick reference.
What are the best free crypto technical analysis apps?
Top free apps include TradingView, CoinMarketCap, and CryptoCompare. These platforms provide real-time charting, technical indicators, and community insights, making them ideal for both beginners and experienced traders.
Are there any free crypto technical analysis courses?
Yes, platforms like Coursera, Udemy, and YouTube offer free courses covering technical analysis basics, chart patterns, and trading strategies. These resources are beginner-friendly and include practical exercises.
How do I use a crypto technical analysis screener?
A crypto technical analysis screener filters coins based on indicators like moving averages, RSI, and MACD. Use screeners to quickly spot trading opportunities that match your strategy and risk profile.
Final Thought
Mastering crypto technical analysis is a journey—one that rewards patience, discipline, and continuous learning. By combining chart-reading skills, the right tools, and a strong community, you can make smarter, more confident investment decisions in the dynamic world of digital assets. Remember: every chart tells a story, and with practice, you’ll learn to read between the lines.
References:
This article is for educational purposes only and does not constitute financial advice. Always do your own research and consult with a qualified advisor before making investment decisions.


Leave a Reply